Analyse a dataset, step by step
A real task, not a feature demo: pull a public dataset off the web, cut it down to a workable sample, compute some numbers, chart them, and finally hand a few raw examples to an agent for a read no statistic gives you. Each step is one compose block on a single page — you press them in turn, and each builds on the file the last one left behind.
The data is Amazon’s public Topical-Chat corpus — thousands of open-domain conversations, each turn tagged with a sentiment. We take one file of it and walk from raw JSON to a finished chart plus a qualitative summary, entirely inside one Workbook page.
This tour uses a demo project data-analysis. Every block below is
copy-pasteable: open a workpage, type /compose, and paste the YAML.
Table of contents
- One page, five blocks
- Working toward the result
- A closer look at each block
- 1 · Pull the data
- 2 · Truncate to 10
- 3 · Simple analysis
- 4 · Chart the sentiment
- 5 · Ask the model
- What this shows
- Where to go next
One page, five blocks
The whole analysis is a single page. Five compose blocks stacked top to
bottom, each with its own ▶ Run button — and all naming the same workspace
topical, so the file one block writes is still there for the next. The data
flows down the page.
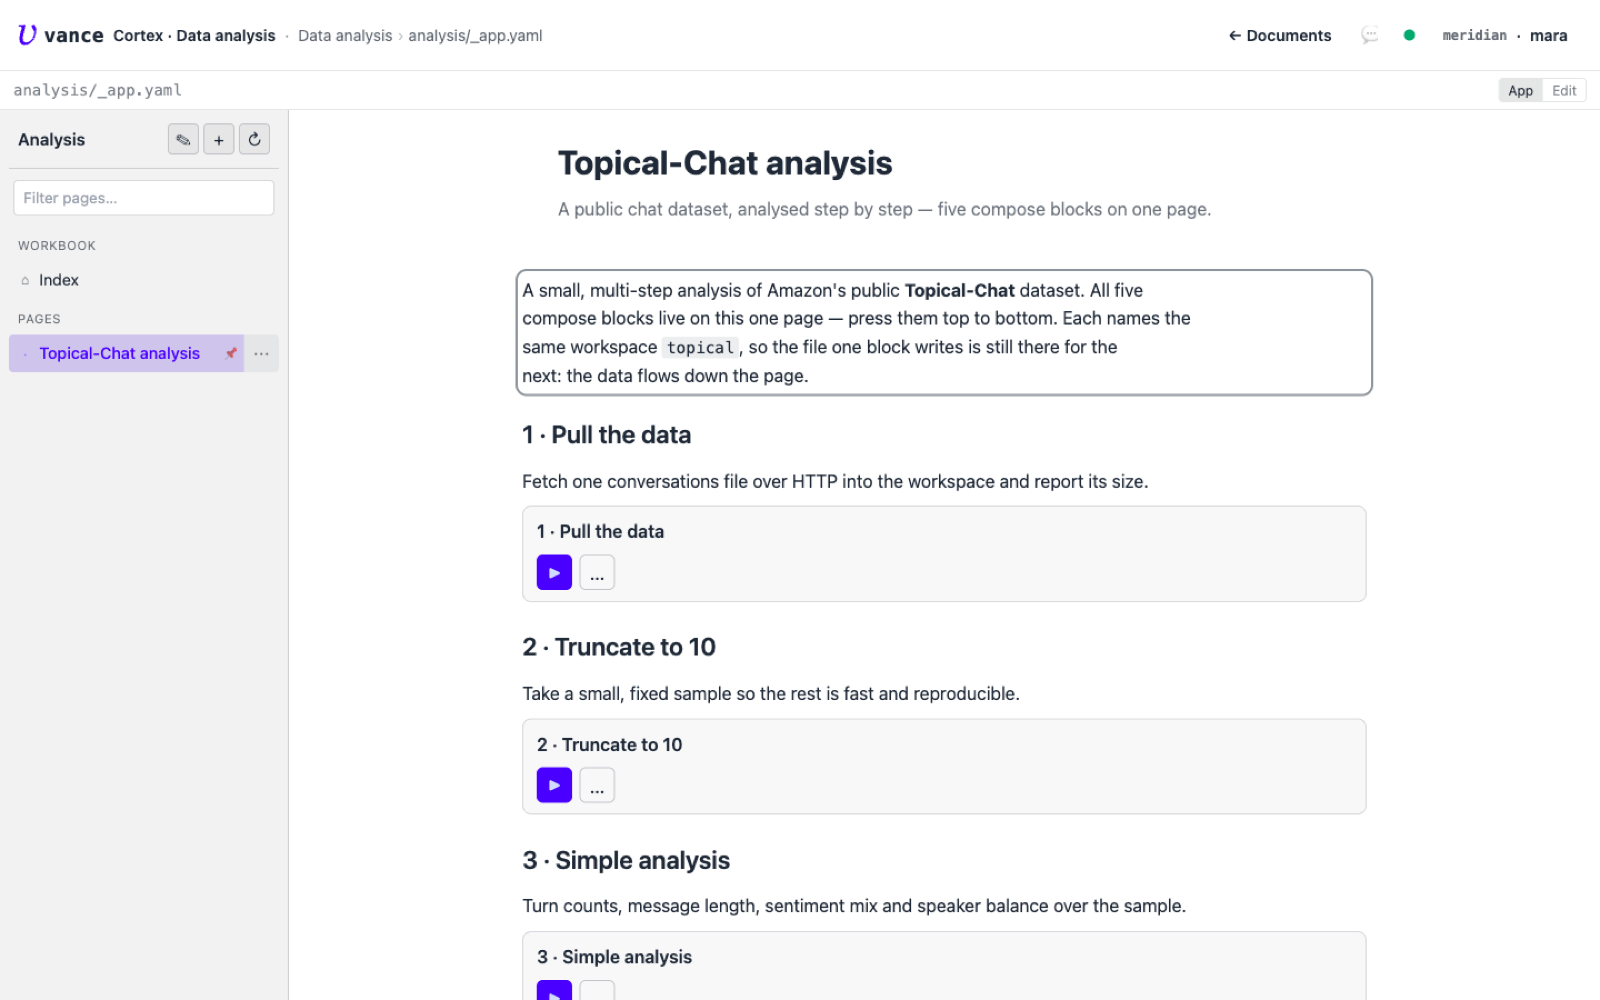
- Pull the raw conversations file into the workspace.
- Truncate it to a fixed sample of 10 (fast, reproducible).
- Analyse the sample — turns, message length, sentiment mix.
- Chart the sentiment counts as a native Vancetope chart.
- Ask an agent to characterise the conversation style from real turns.
You don’t reach the goal in one shot — you reach it by pressing buttons in order, each standing on the output of the one before.
Working toward the result
This is the real point of compose, and what a one-shot script or a notebook cell doesn’t give you: each block runs on its own, so you build up to the answer — try, break, fix, replay, branch, or hand it to the agent. The slideshow walks the moves; none of them need the others.
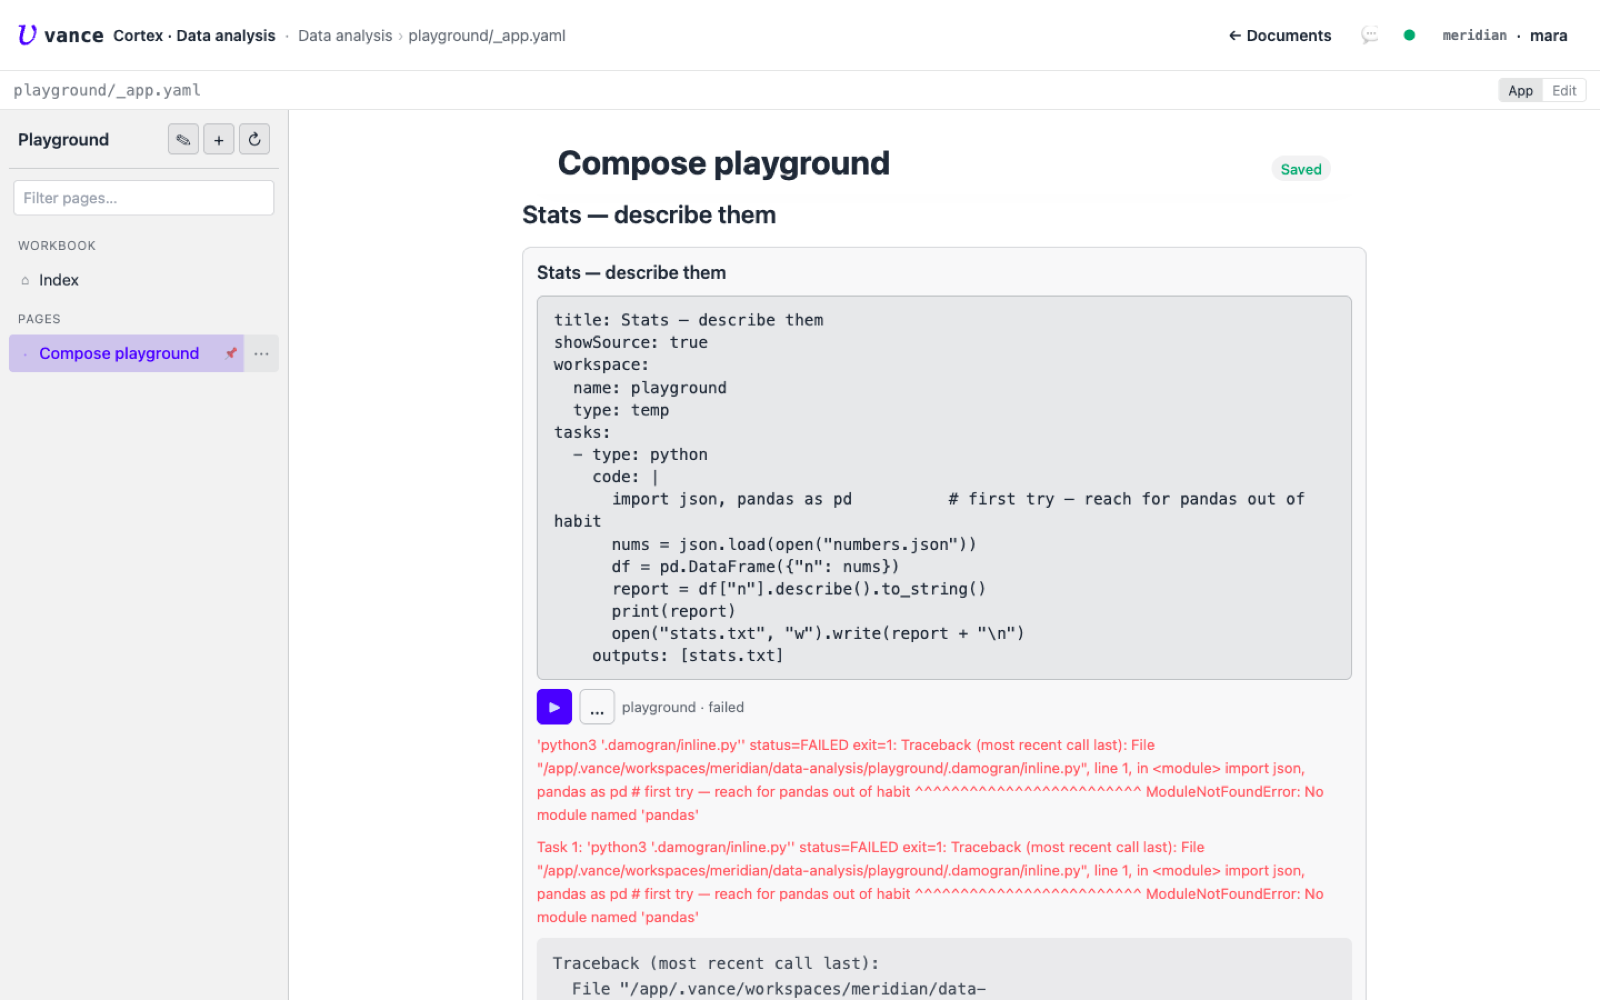
pandas, which isn't in the image — a red ModuleNotFoundError, and that's fine. Nothing else broke; the workspace still holds what earlier blocks wrote.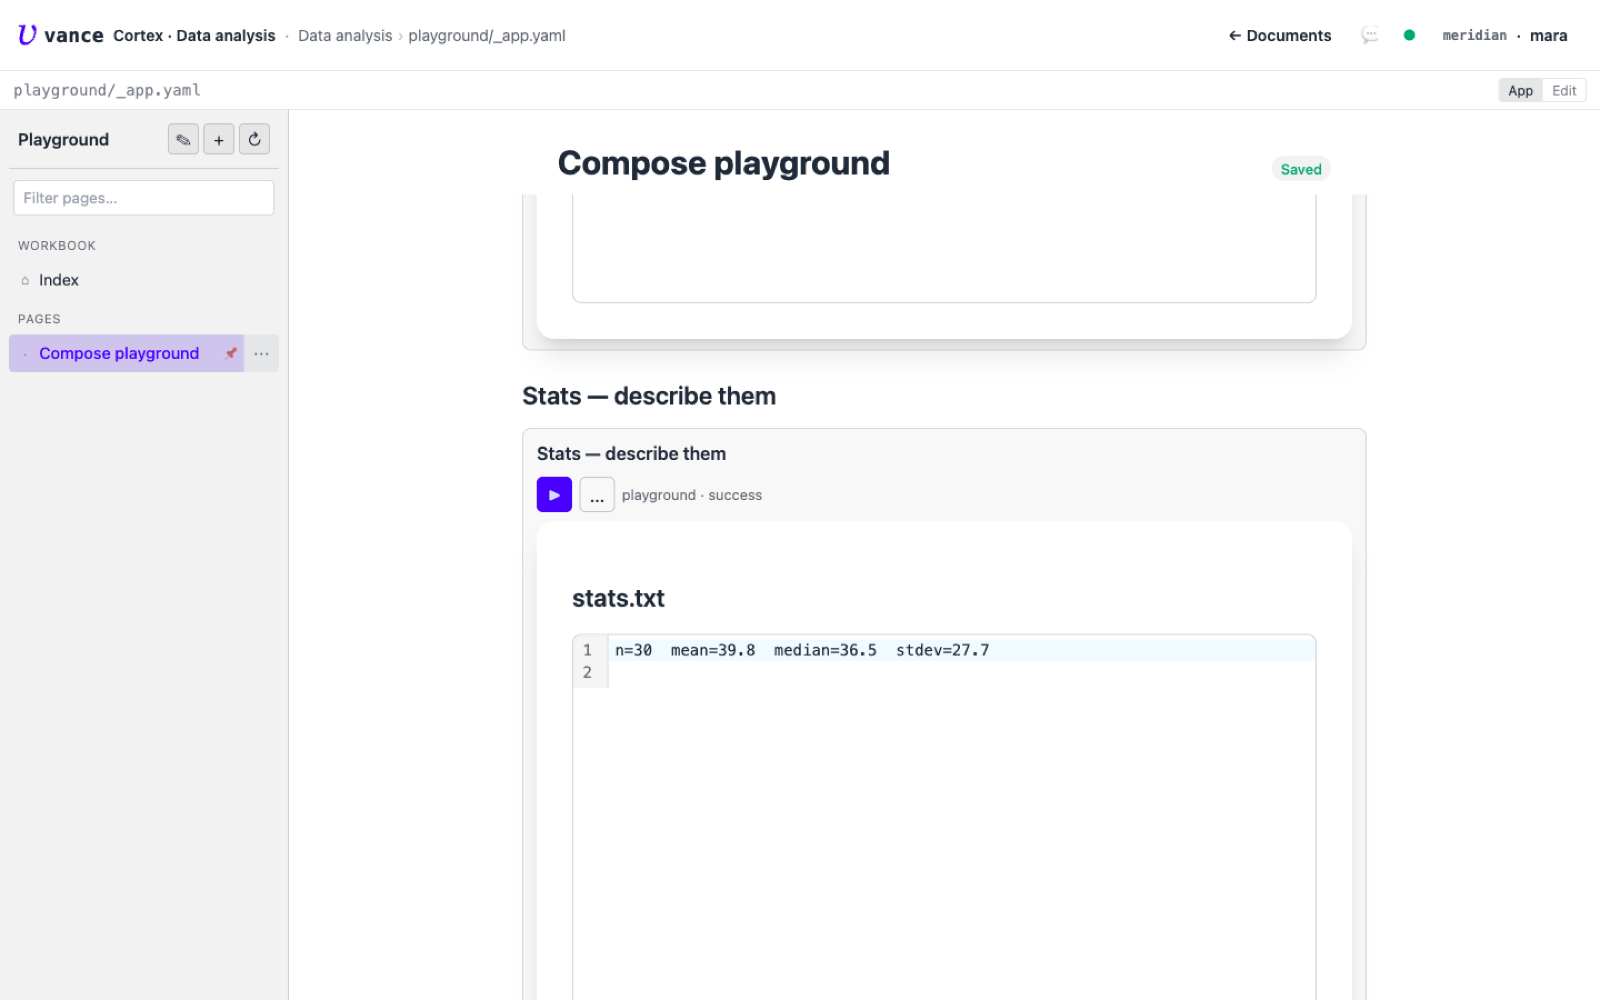
pandas for the standard library, press ▶ again — success, and the stats come back. You replay just the one block; no need to re-run the steps before it.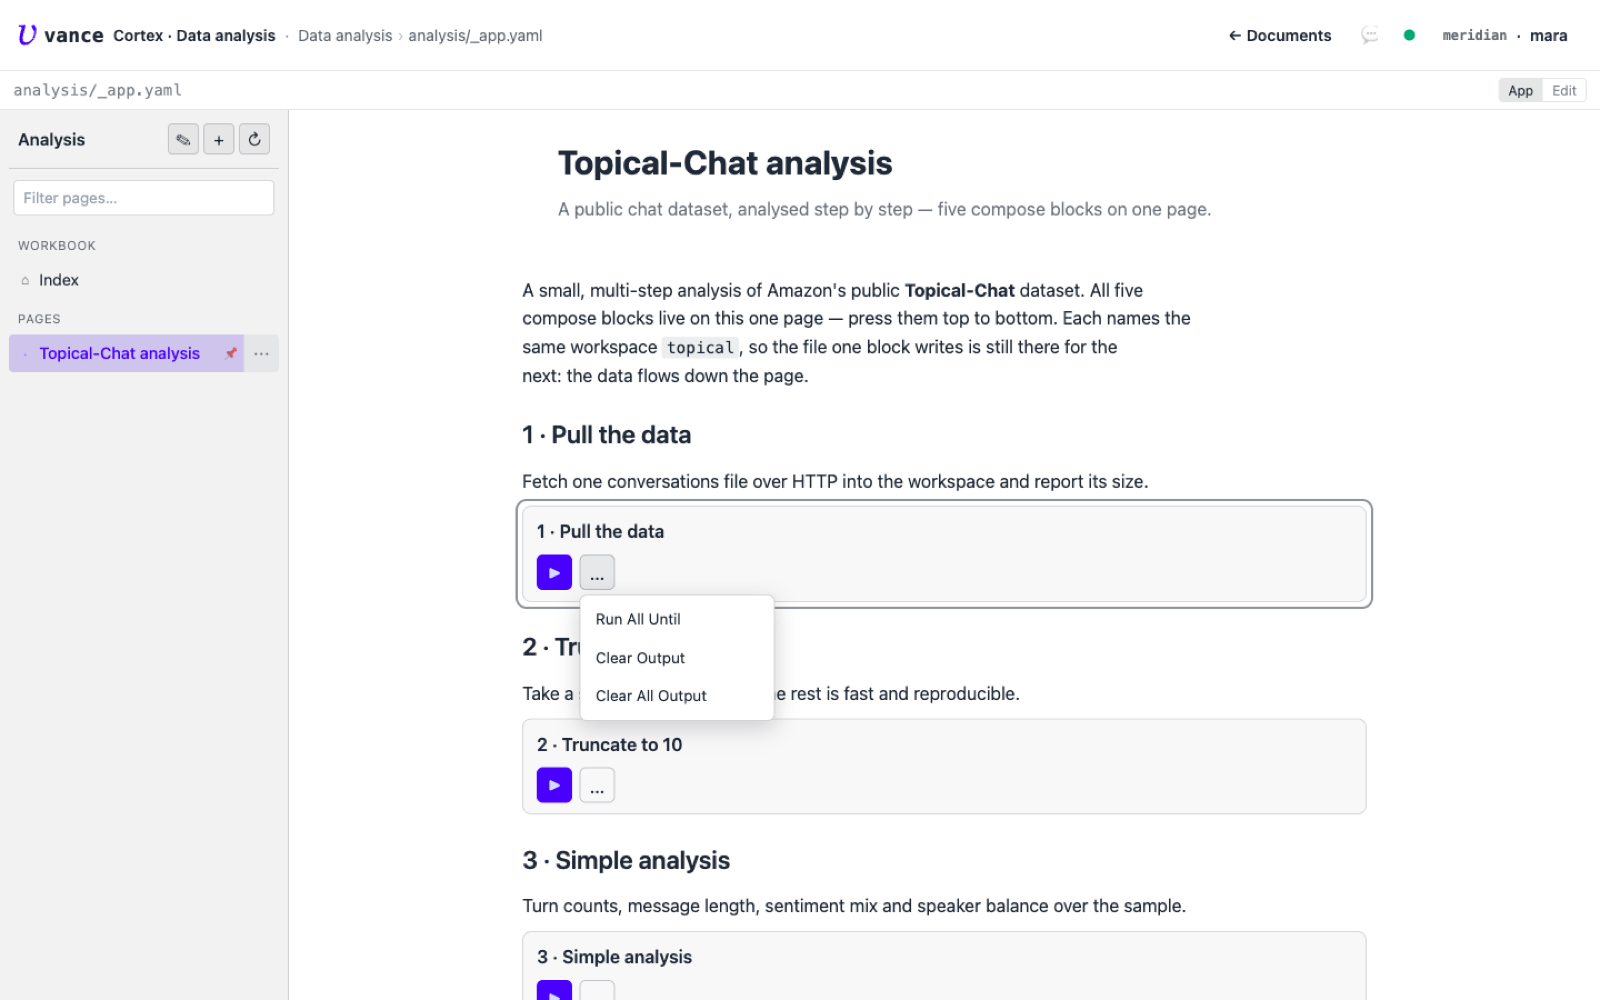
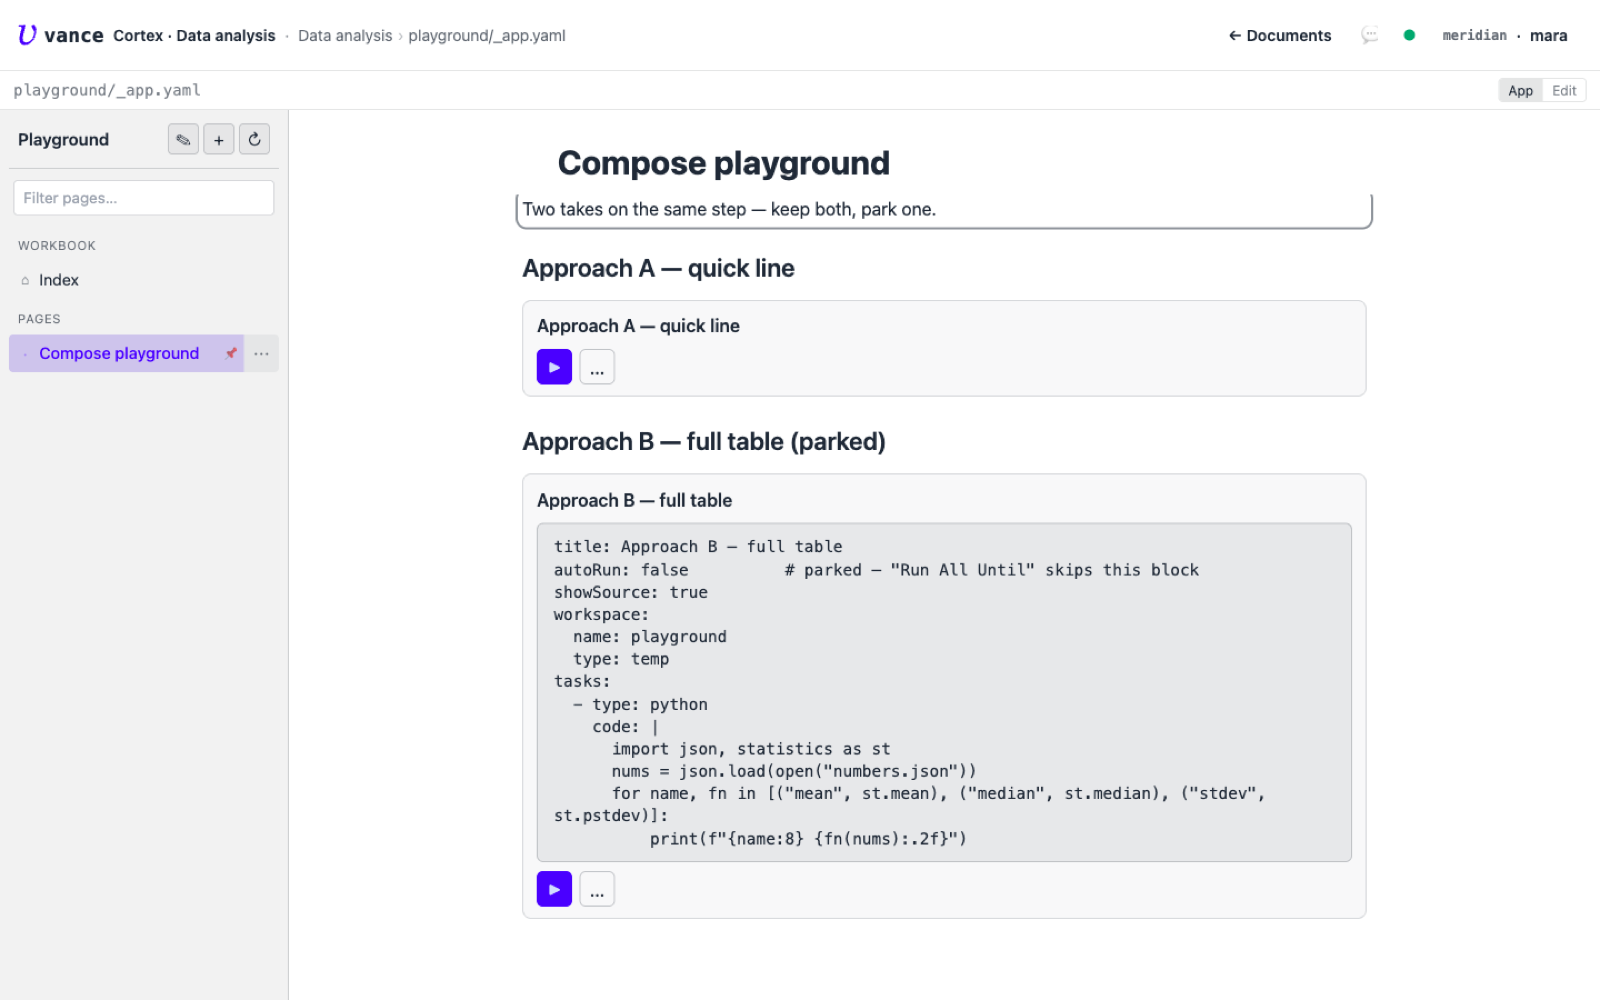
autoRun: false — "Run All Until" skips it, but its own ▶ still runs it so you can compare. Flip the flag when a winner emerges.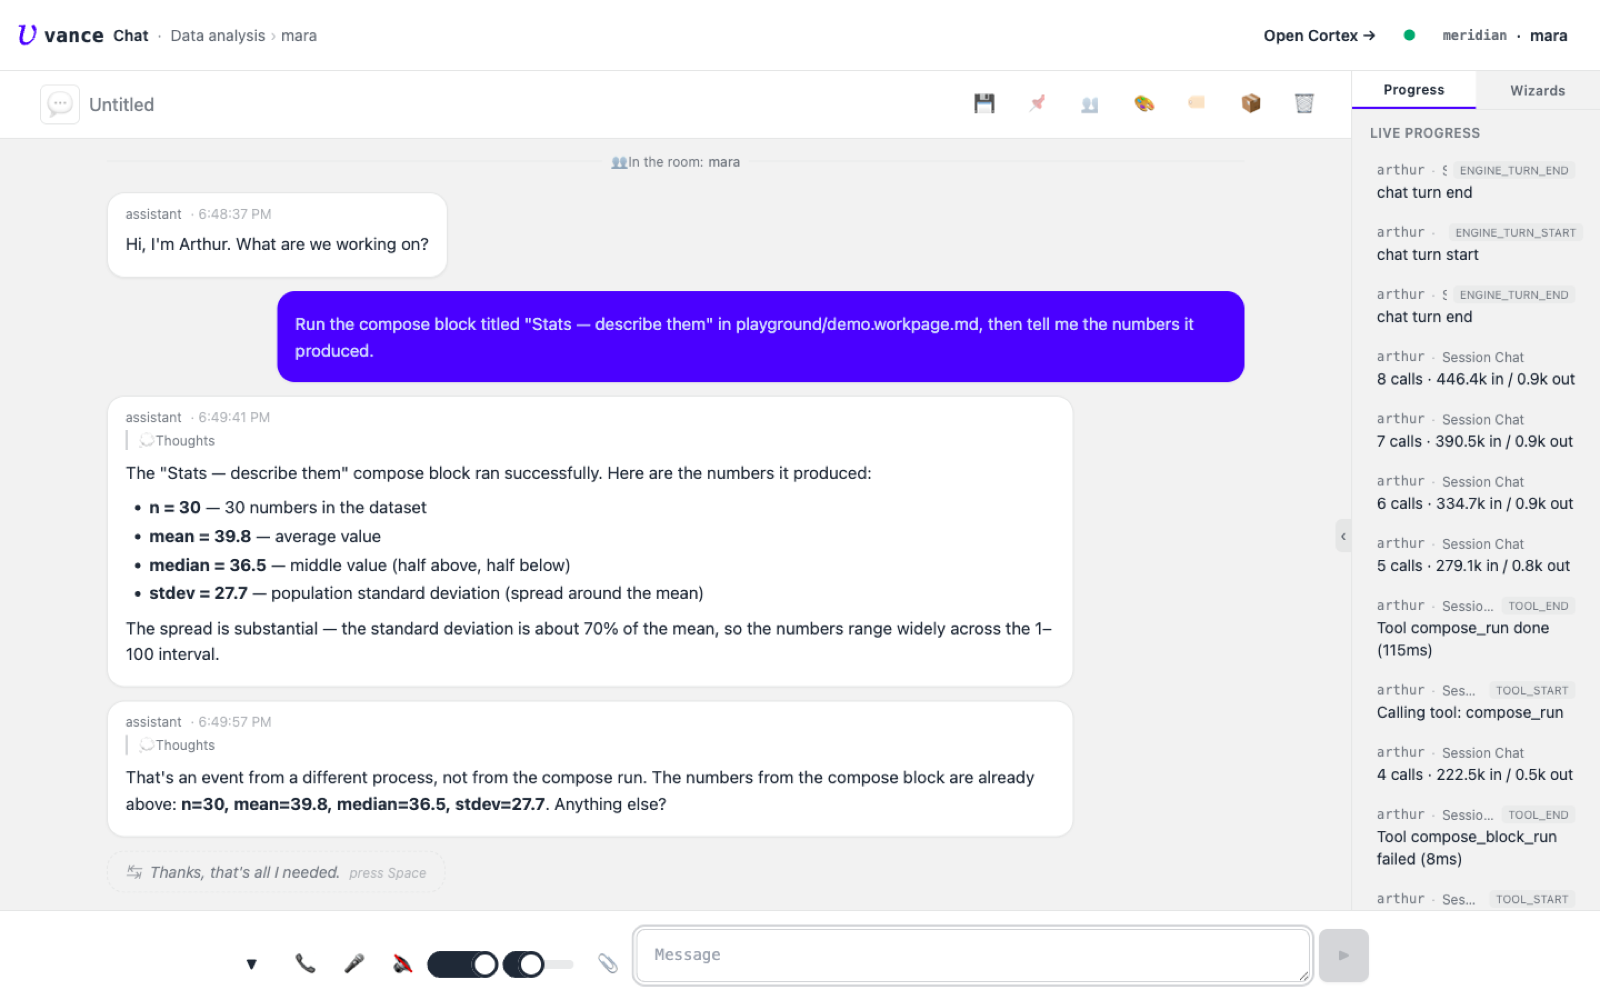
compose_run in the live-progress panel) and reads back the numbers — it can rewrite a block too. Same run path as ▶; the output lands in the page.One more knob worth knowing: a block with workspace: { clear: true } wipes the
workspace before it runs, so you can reset and replay the whole page from nothing.
A closer look at each block
The rest of this page walks each block up close — the script it runs and the result it produces — so you can copy them and follow the happy path end to end.
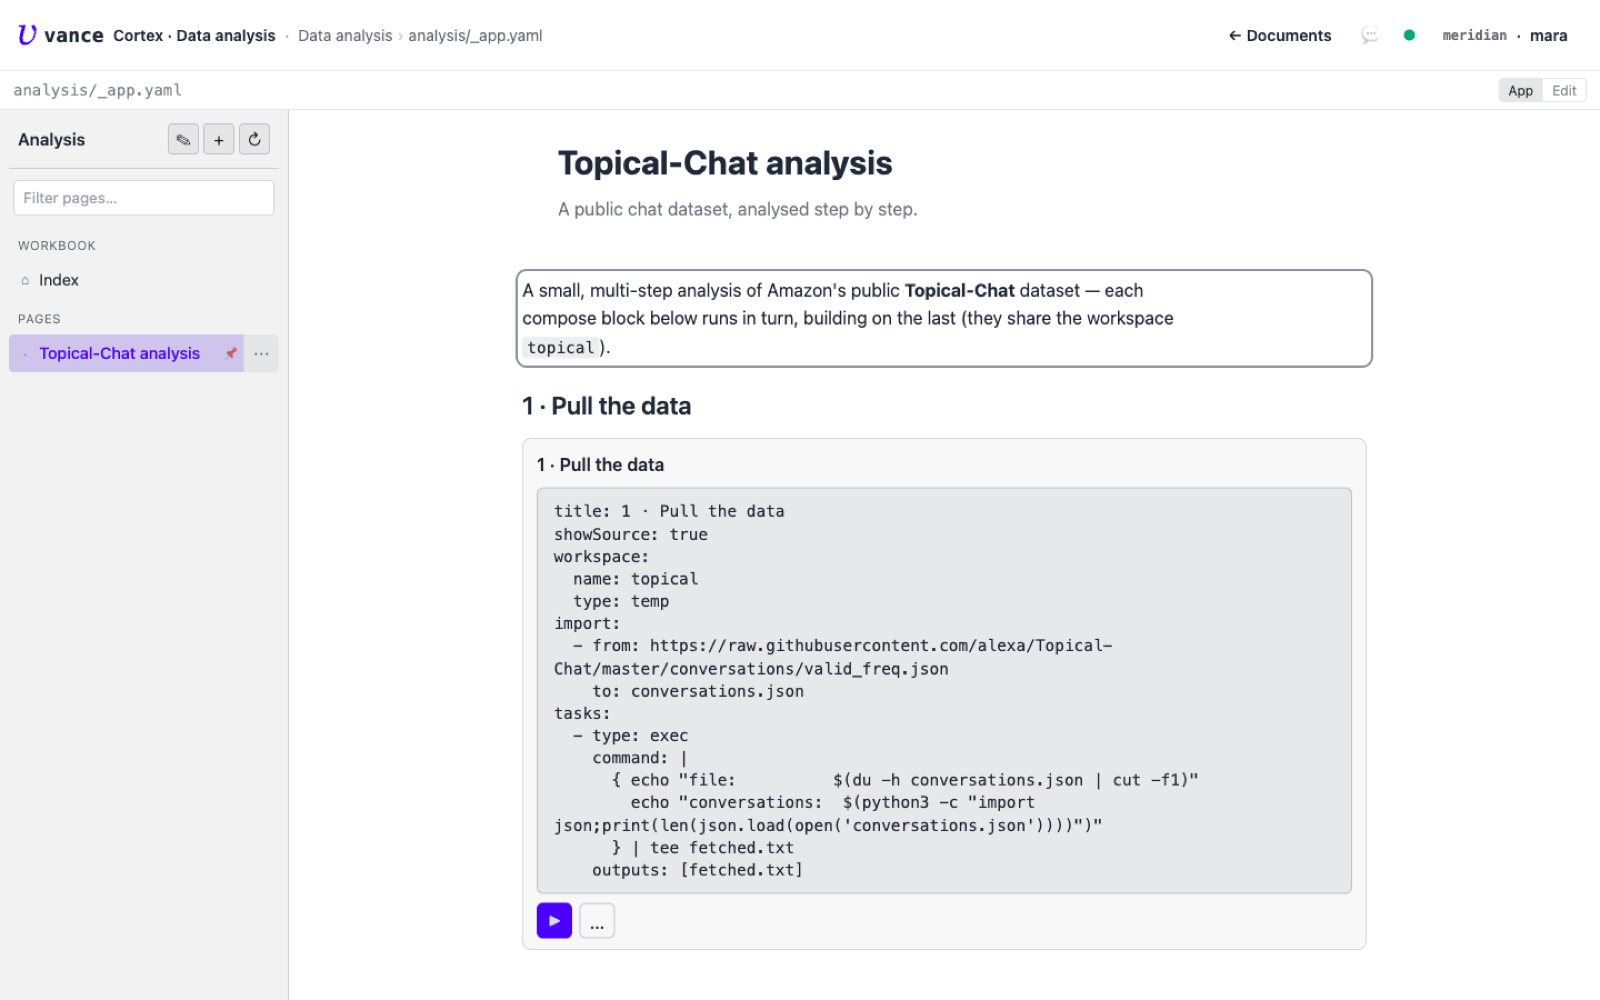
1 · Pull the data
An import fetches the file over HTTP straight into the workspace; a one-line
exec reports its size and how many conversations it holds.
```vance-compose
title: 1 · Pull the data
workspace:
  name: topical
  type: temp
import:
  - from: https://raw.githubusercontent.com/alexa/Topical-Chat/master/conversations/valid_freq.json
    to: conversations.json
tasks:
  - type: exec
    command: |
      { echo "file:          $(du -h conversations.json | cut -f1)"
        echo "conversations:  $(python3 -c "import json;print(len(json.load(open('conversations.json'))))")"
      } | tee fetched.txt
    outputs: [fetched.txt]
```
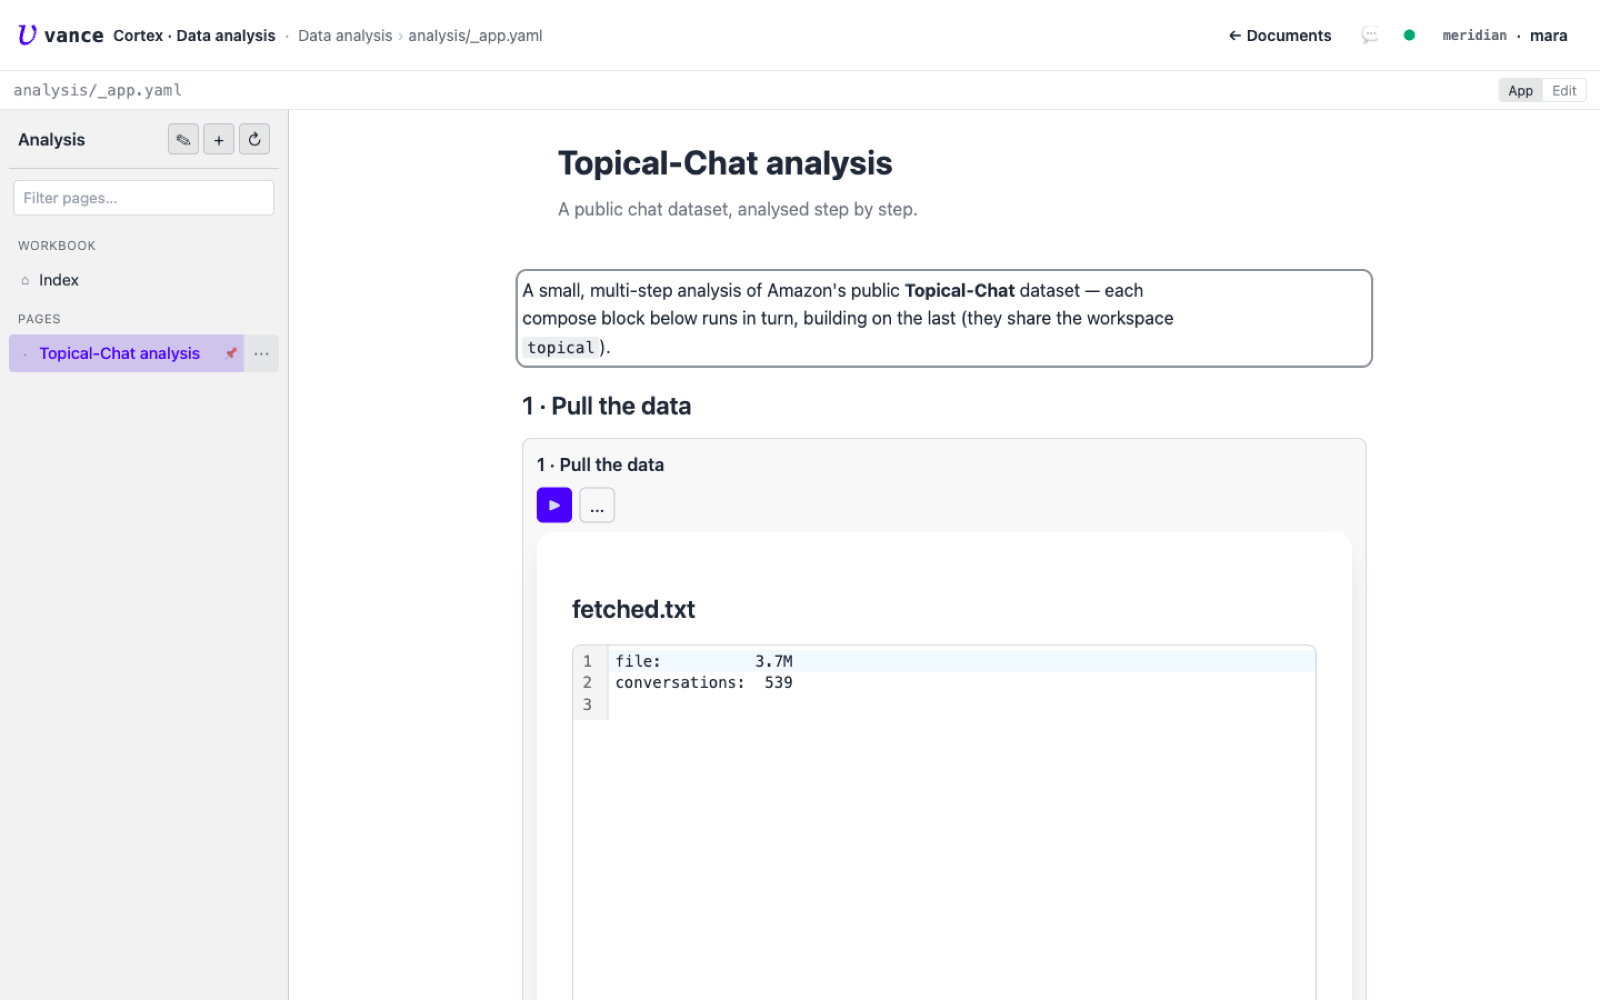
fetched.txt comes back: a 3.7 MB file, 539 conversations. The data now lives in the shared topical workspace.2 · Truncate to 10
539 conversations is more than a showcase needs — and if we sent them all to an
agent later it would cost real tokens. So we take a fixed sample of 10. The
cap is a plain parameter (LIMIT = 10) and the seed is fixed, so the sample is
the same every run.
```vance-compose
title: 2 · Truncate to 10
workspace:
  name: topical
  type: temp
tasks:
  - type: python
    code: |
      import json, random
      LIMIT = 10                        # our artificial cap for this showcase
      convos = json.load(open("conversations.json"))
      ids = sorted(convos)
      random.Random(42).shuffle(ids)
      picked = ids[:LIMIT]
      subset = {cid: convos[cid] for cid in picked}
      json.dump(subset, open("subset.json", "w"))
      msgs = sum(len(convos[c]["content"]) for c in picked)
      report = f"kept {len(subset)} of {len(convos)} conversations, {msgs} messages\n"
      print(report, end="")
      open("subset-summary.txt", "w").write(report)
    outputs: [subset-summary.txt]
```
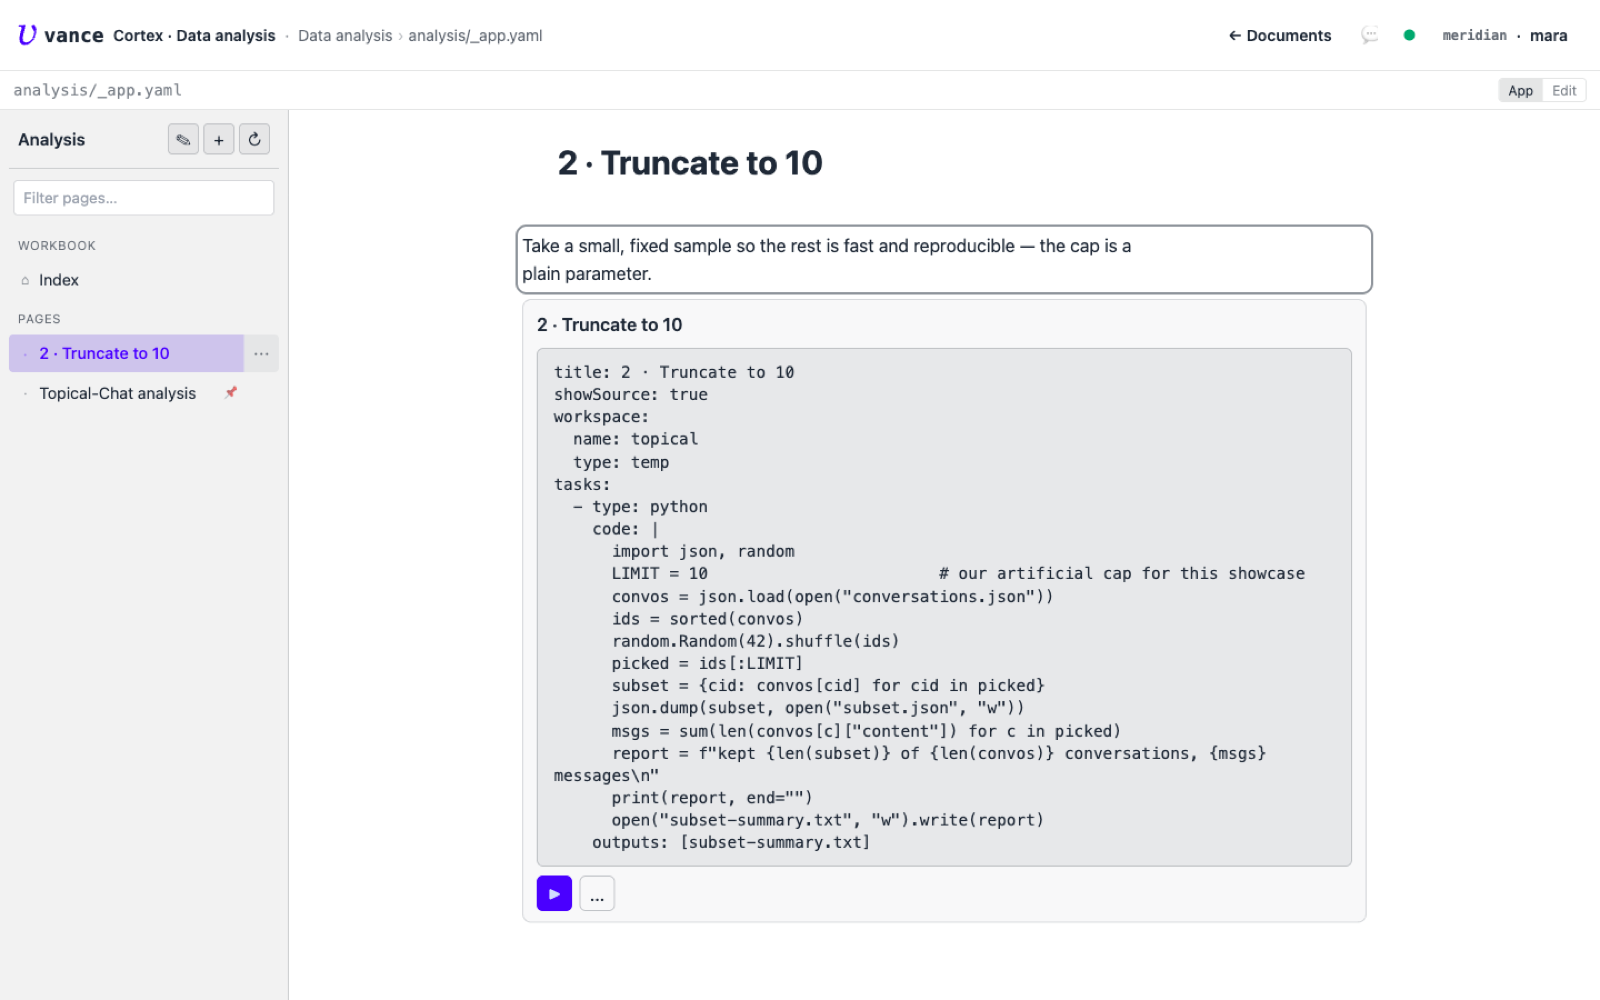
python task reads conversations.json (left by step 1), samples 10 with a fixed seed, and writes subset.json.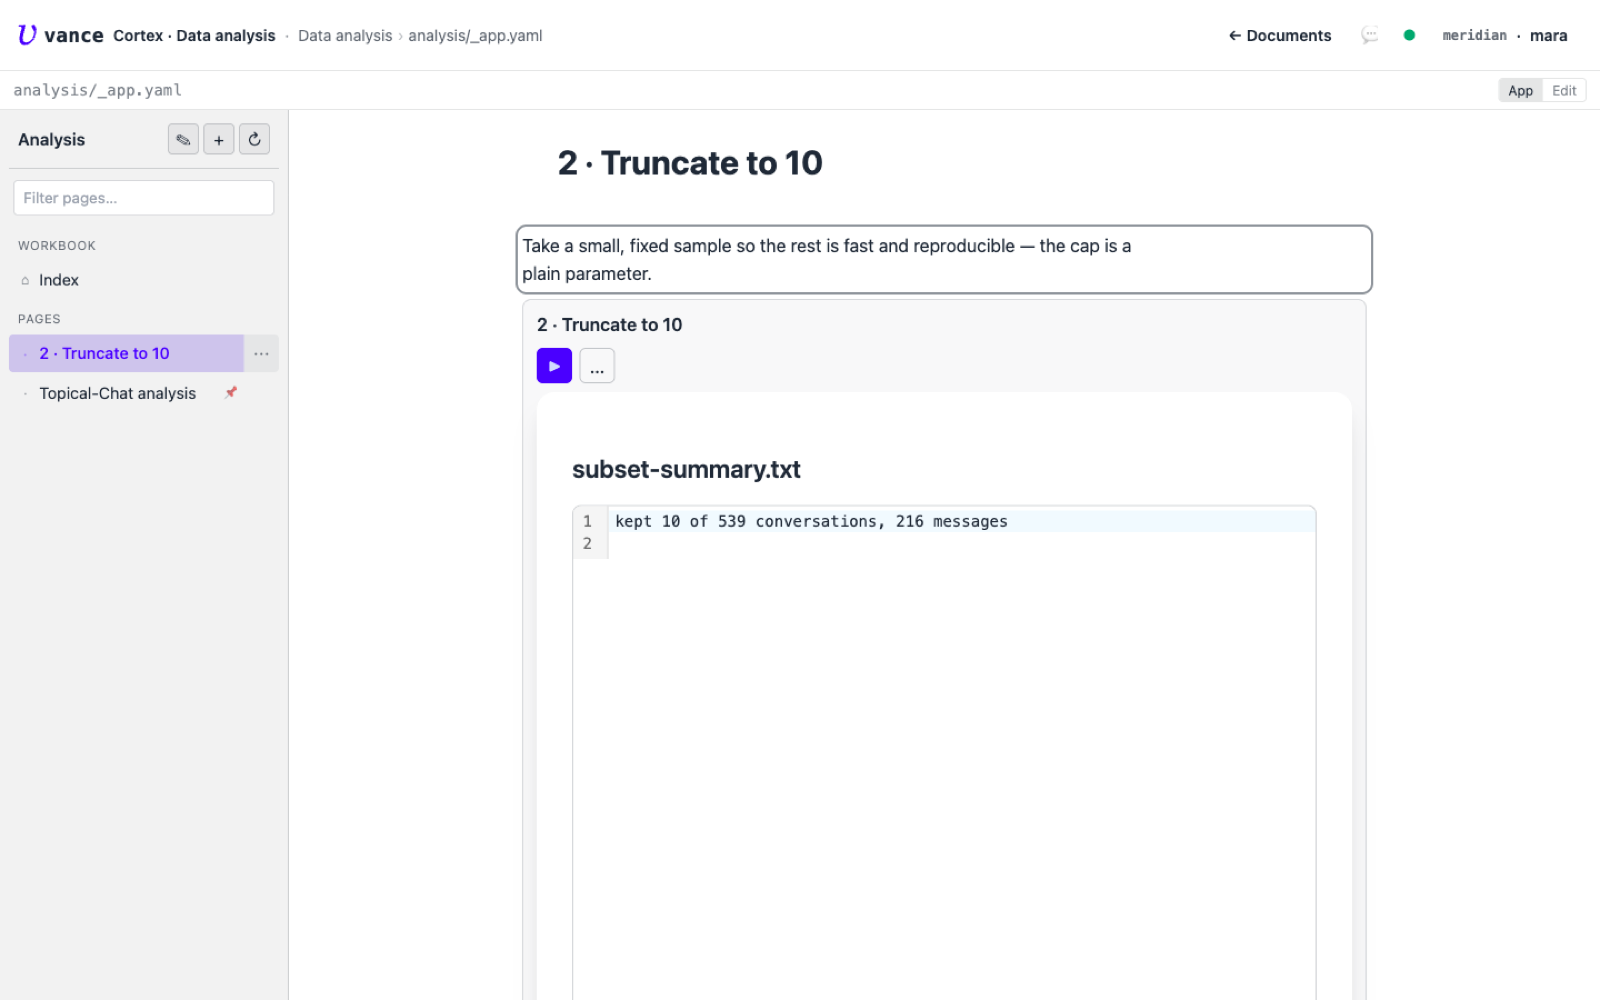
3 · Simple analysis
Now the numbers. Over the 10-conversation subset: turns per conversation, words per message (mean and median via numpy), the sentiment distribution, and how balanced the two speakers are. It writes a plain-text report the page renders.
```vance-compose
title: 3 · Simple analysis
workspace:
  name: topical
  type: temp
tasks:
  - type: python
    code: |
      import json, numpy as np
      from collections import Counter
      sub = json.load(open("subset.json"))
      turns, words = [], []
      sentiments, agents = Counter(), Counter()
      for c in sub.values():
          content = c["content"]
          turns.append(len(content))
          for m in content:
              words.append(len(m["message"].split()))
              sentiments[m.get("sentiment", "?")] += 1
              agents[m.get("agent", "?")] += 1
      turns, words = np.array(turns), np.array(words)
      out = []
      out.append(f"conversations: {len(sub)}    messages: {int(turns.sum())}")
      out.append(f"turns / conversation:  mean {turns.mean():.1f}   median {int(np.median(turns))}")
      out.append(f"words / message:       mean {words.mean():.1f}   median {int(np.median(words))}")
      out.append("")
      out.append("sentiment:")
      for s, n in sentiments.most_common():
          out.append(f"  {s:<26} {n:>4}  ({100*n/len(words):4.0f}%)")
      out.append("")
      out.append("agent balance:  " + ",  ".join(f"{a} = {n}" for a, n in sorted(agents.items())))
      report = "\n".join(out) + "\n"
      print(report, end="")
      open("stats.txt", "w").write(report)
    outputs: [stats.txt]
```
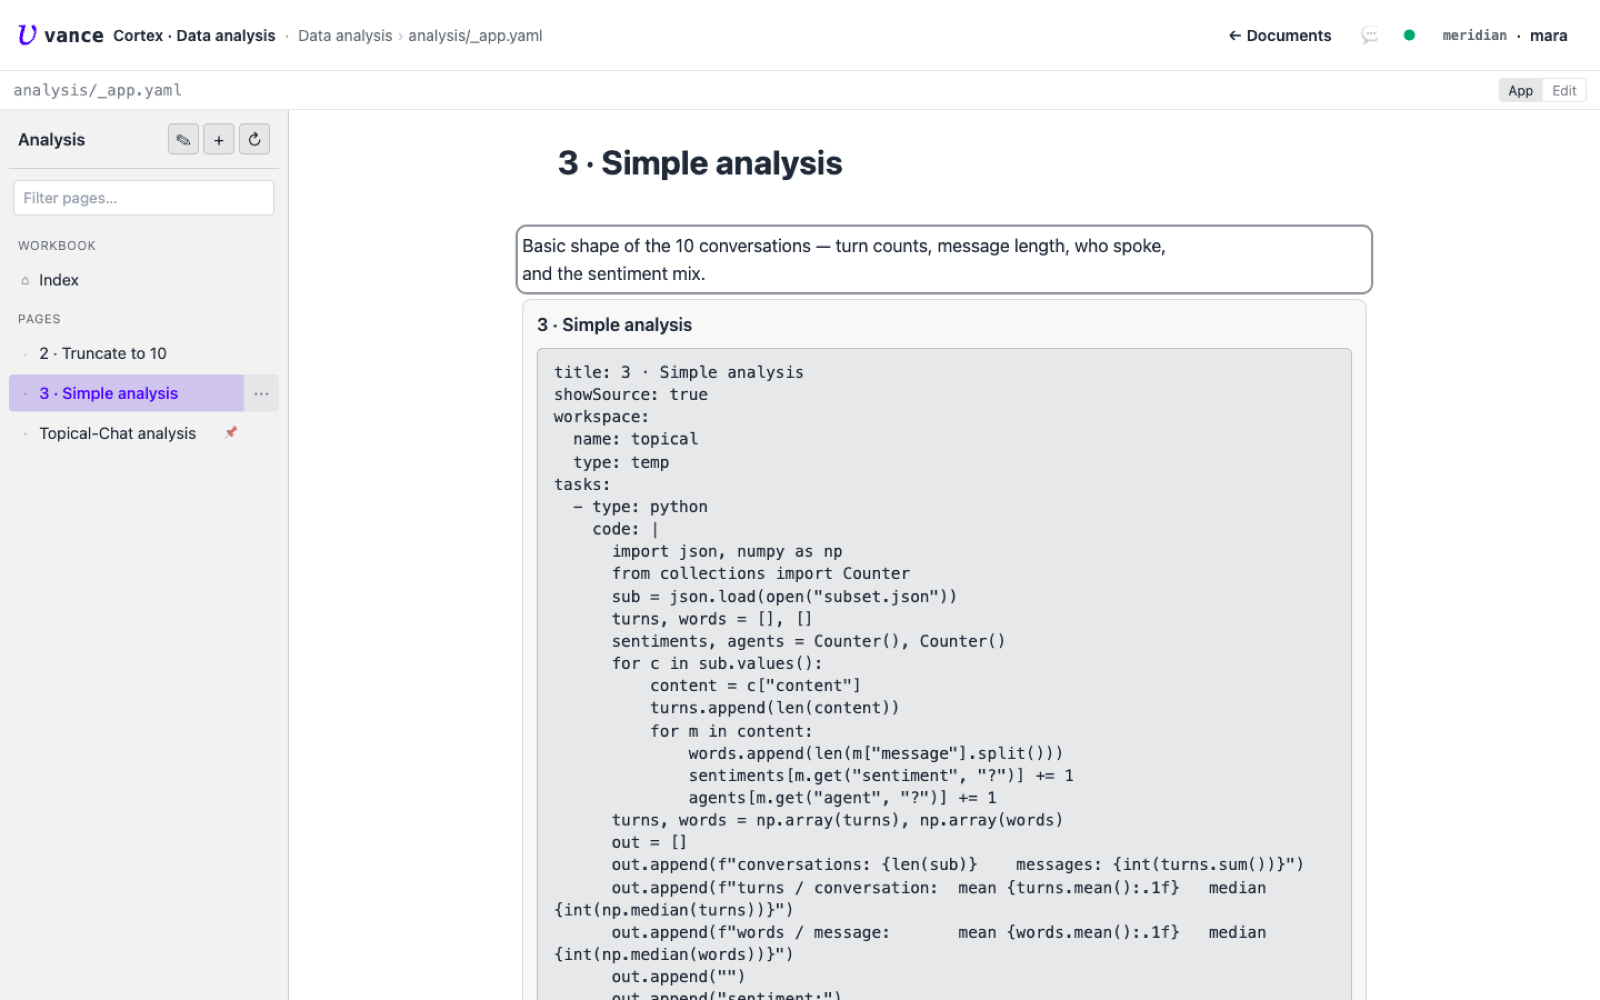
collections.Counter over subset.json — no pandas needed for this.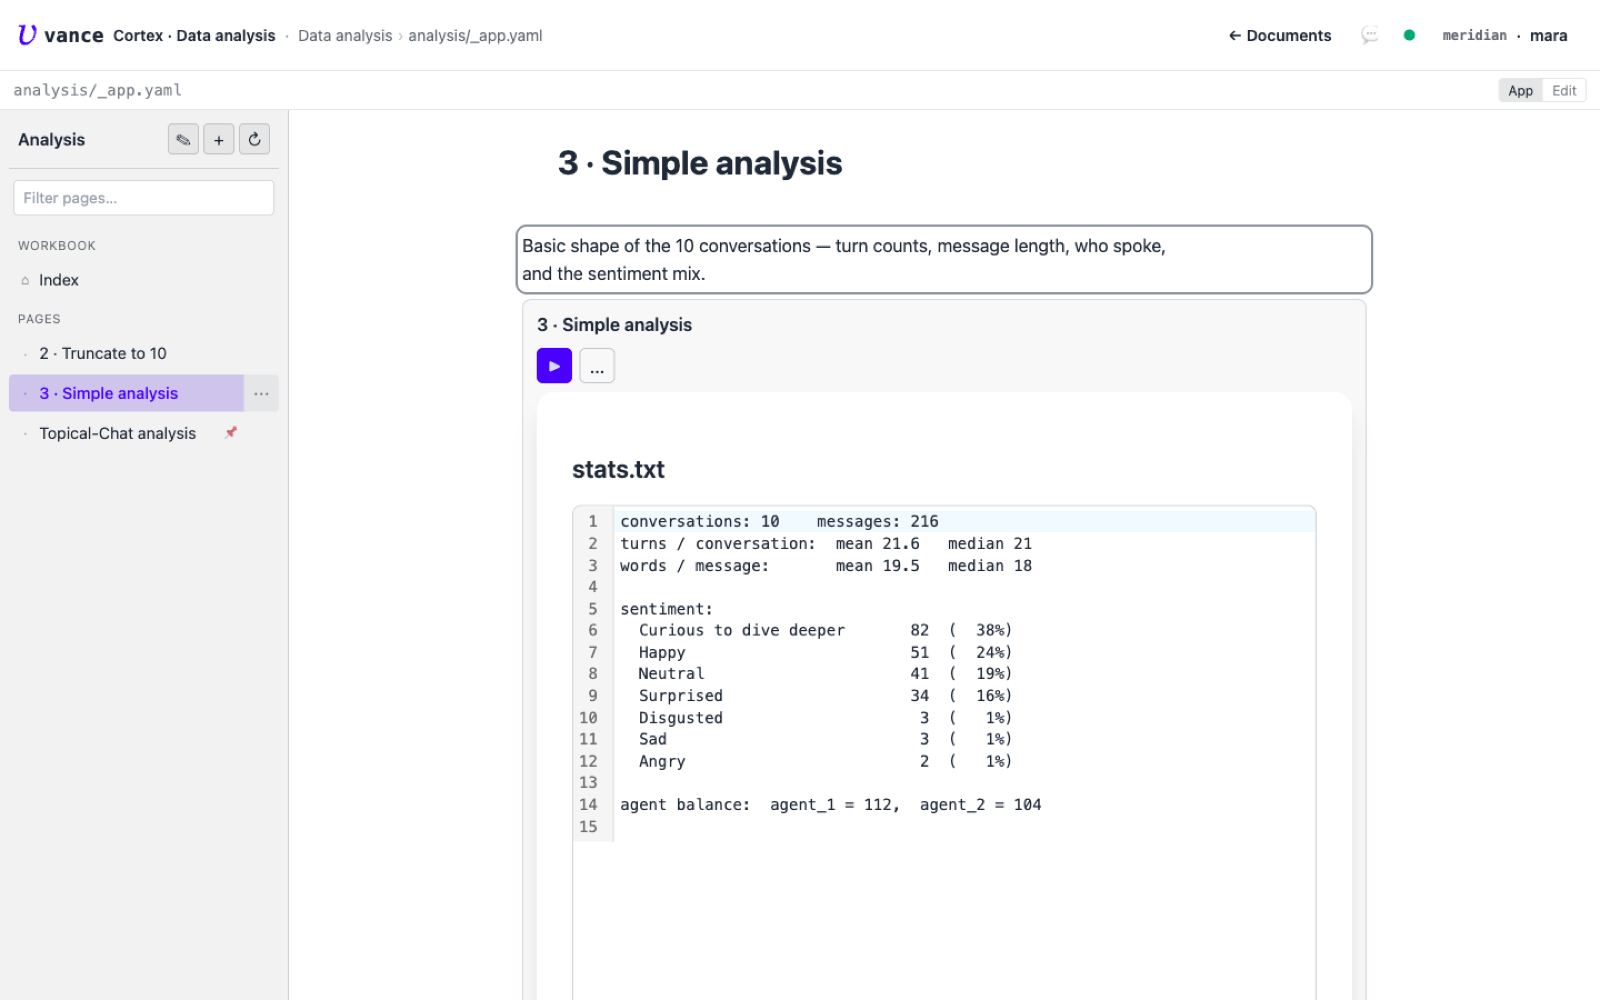
stats.txt: ~21.6 turns per conversation, ~19.5 words per message, sentiment led by Curious (38%) and Happy (24%), speakers near-balanced.4 · Chart the sentiment
A table of counts is fine; a chart is better. This block builds a native Vancetope
chart document from the sentiment counts and exports it into the project —
where it opens as a real, editable bar chart, not a static image.
```vance-compose
title: 4 · Chart the sentiment
workspace:
  name: topical
  type: temp
tasks:
  - type: python
    code: |
      import json
      from collections import Counter
      sub = json.load(open("subset.json"))
      sent = Counter()
      for c in sub.values():
          for m in c["content"]:
              sent[m.get("sentiment", "?")] += 1
      chart = {
          "$meta": {"kind": "chart"},
          "chart": {"chartType": "bar", "title": "Sentiment across 10 conversations"},
          "xAxis": {"type": "category"},
          "yAxis": {"type": "value"},
          "series": [{"name": "messages",
                      "data": [{"x": s, "y": n} for s, n in sent.most_common()]}],
      }
      json.dump(chart, open("sentiment.chart.json", "w"), indent=2)
      print("wrote sentiment.chart.json:", dict(sent.most_common()))
    outputs: [sentiment.chart.json]
export:
  - from: sentiment.chart.json
    to: vance:/sentiment.chart.json
```
The trick is the $meta: {kind: chart} the script writes into the JSON. As a
workspace file it’s just JSON; once exported into the project as
sentiment.chart.json, Vancetope recognises the kind and renders it.
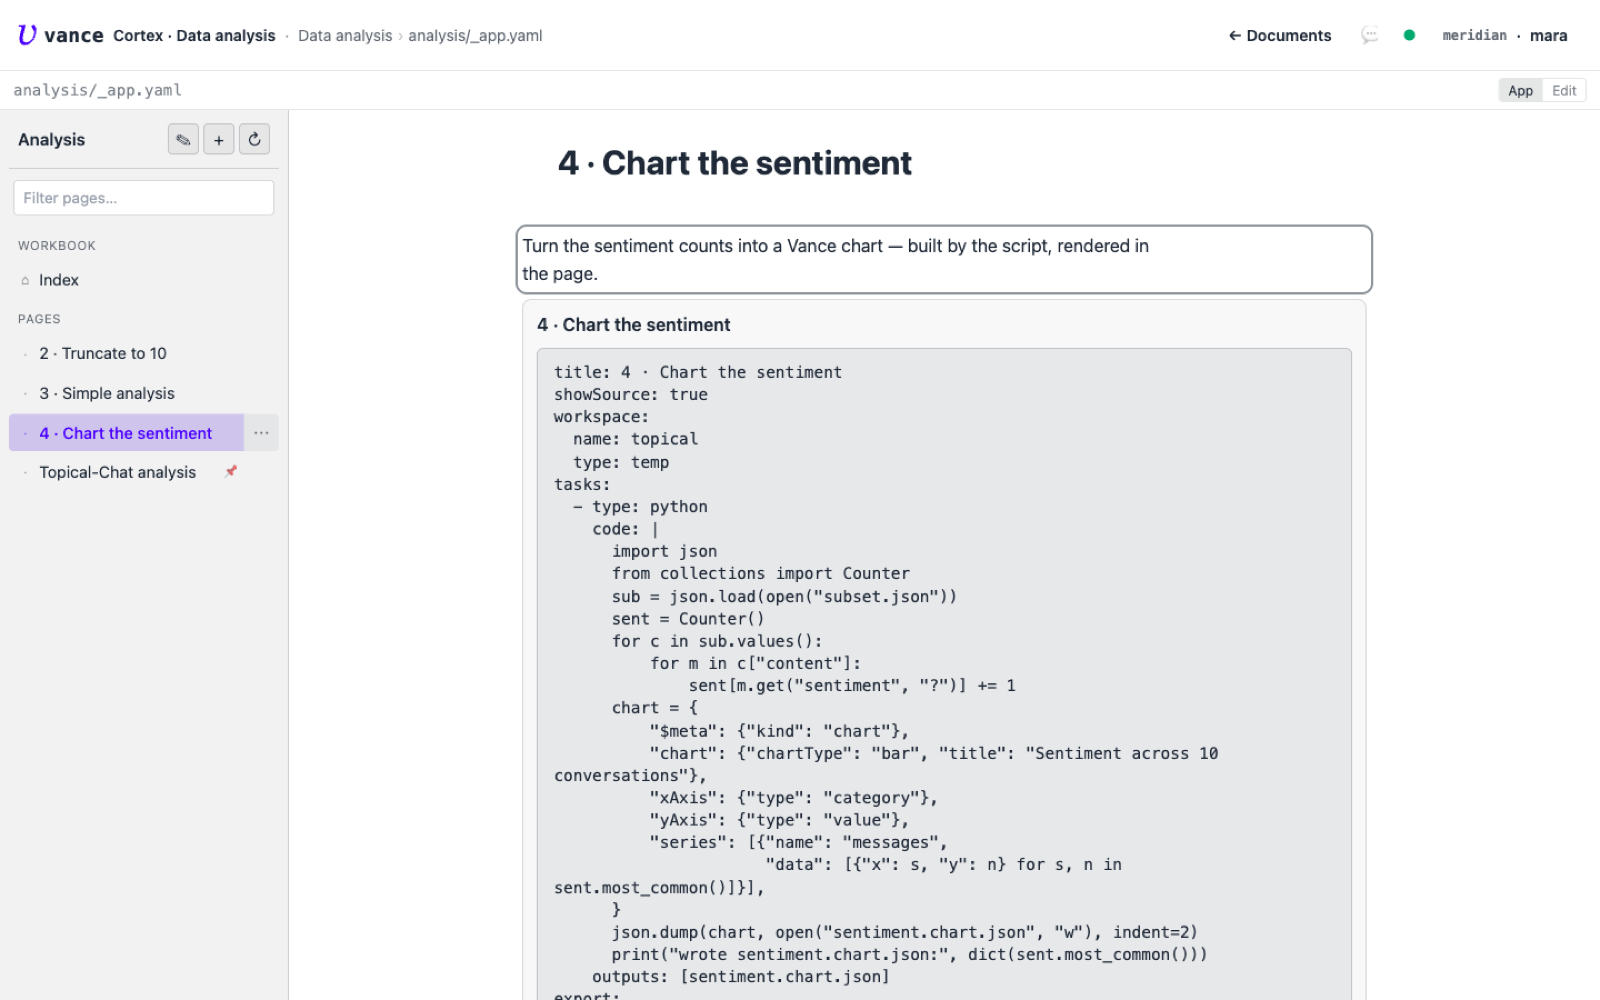
kind: chart document and exports it to vance:/sentiment.chart.json.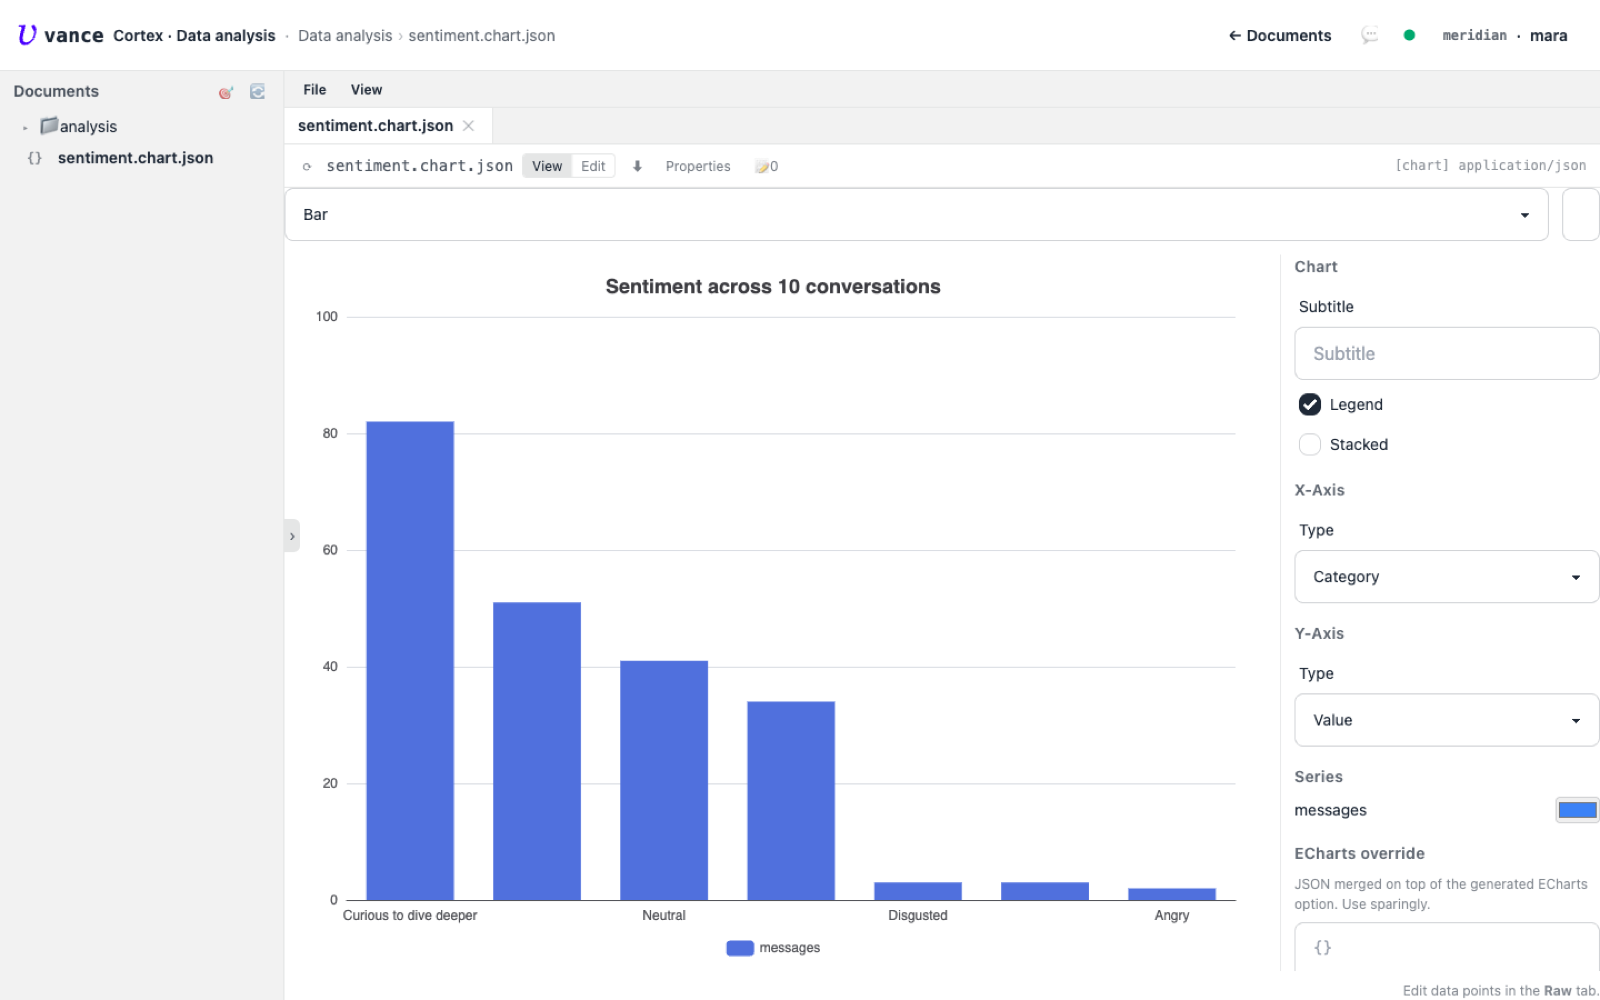
5 · Ask the model
Numbers describe the shape; they don’t tell you what the conversations feel
like. The last block hands a handful of real turns to an agent — a session
with the arthur recipe plus a type: agent task — and asks for a qualitative
read. This one spends real tokens, which is exactly why step 2 capped the sample.
```vance-compose
title: 5 · Ask the model
workspace:
  name: topical
  type: temp
session:
  recipe: arthur
  enabled: true
tasks:
  - type: agent
    recipe: arthur
    prompt: |
      These are sample turns from the Topical-Chat conversations we just analysed
      (10 conversations, ~22 turns each; sentiment skews Curious / Happy):

      agent_1 [Neutral]: Hey, how you doing there?
      agent_2 [Happy]: wonderful how about you
      agent_1 [Curious]: I'm great! Have you heard of the sport called football?
      agent_2 [Happy]: Yes! I live in America and just watched the super bowl!
      agent_1 [Neutral]: Sometimes I watch the SB. Funny that in the 60's bowlers made twice as much as top football stars.
      agent_2 [Curious]: Also find that funny. Are you from the US?

      In two or three sentences, what characterises this conversation style?
```
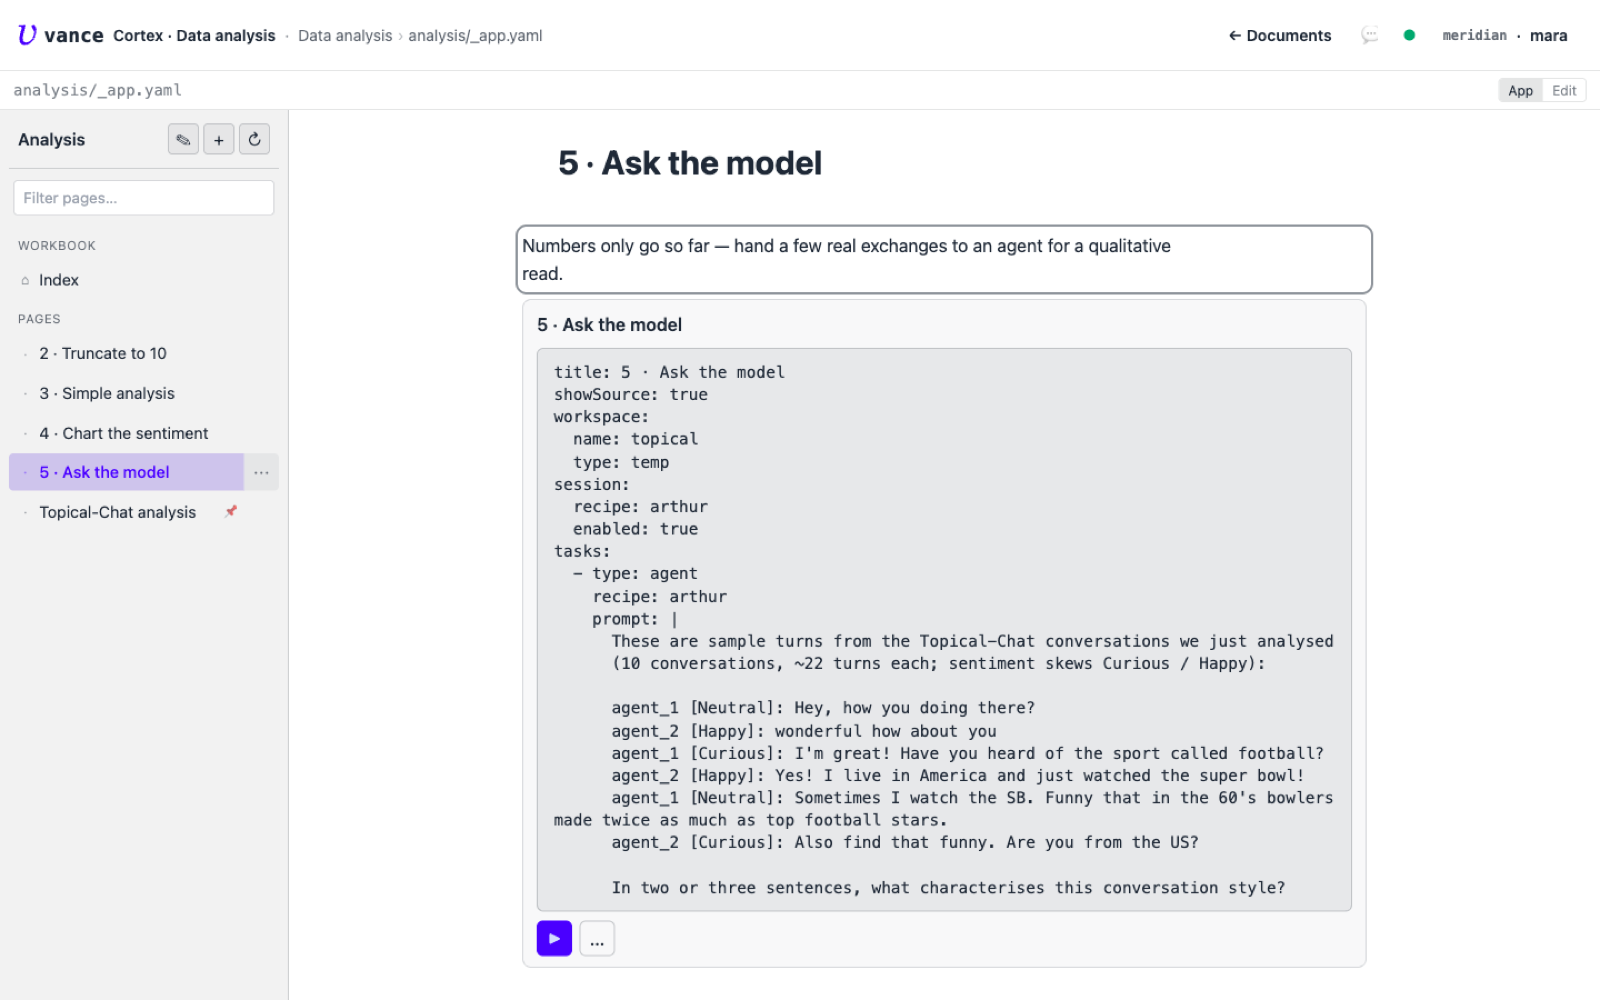
session (recipe arthur) and a type: agent task carrying six real sample turns and the question.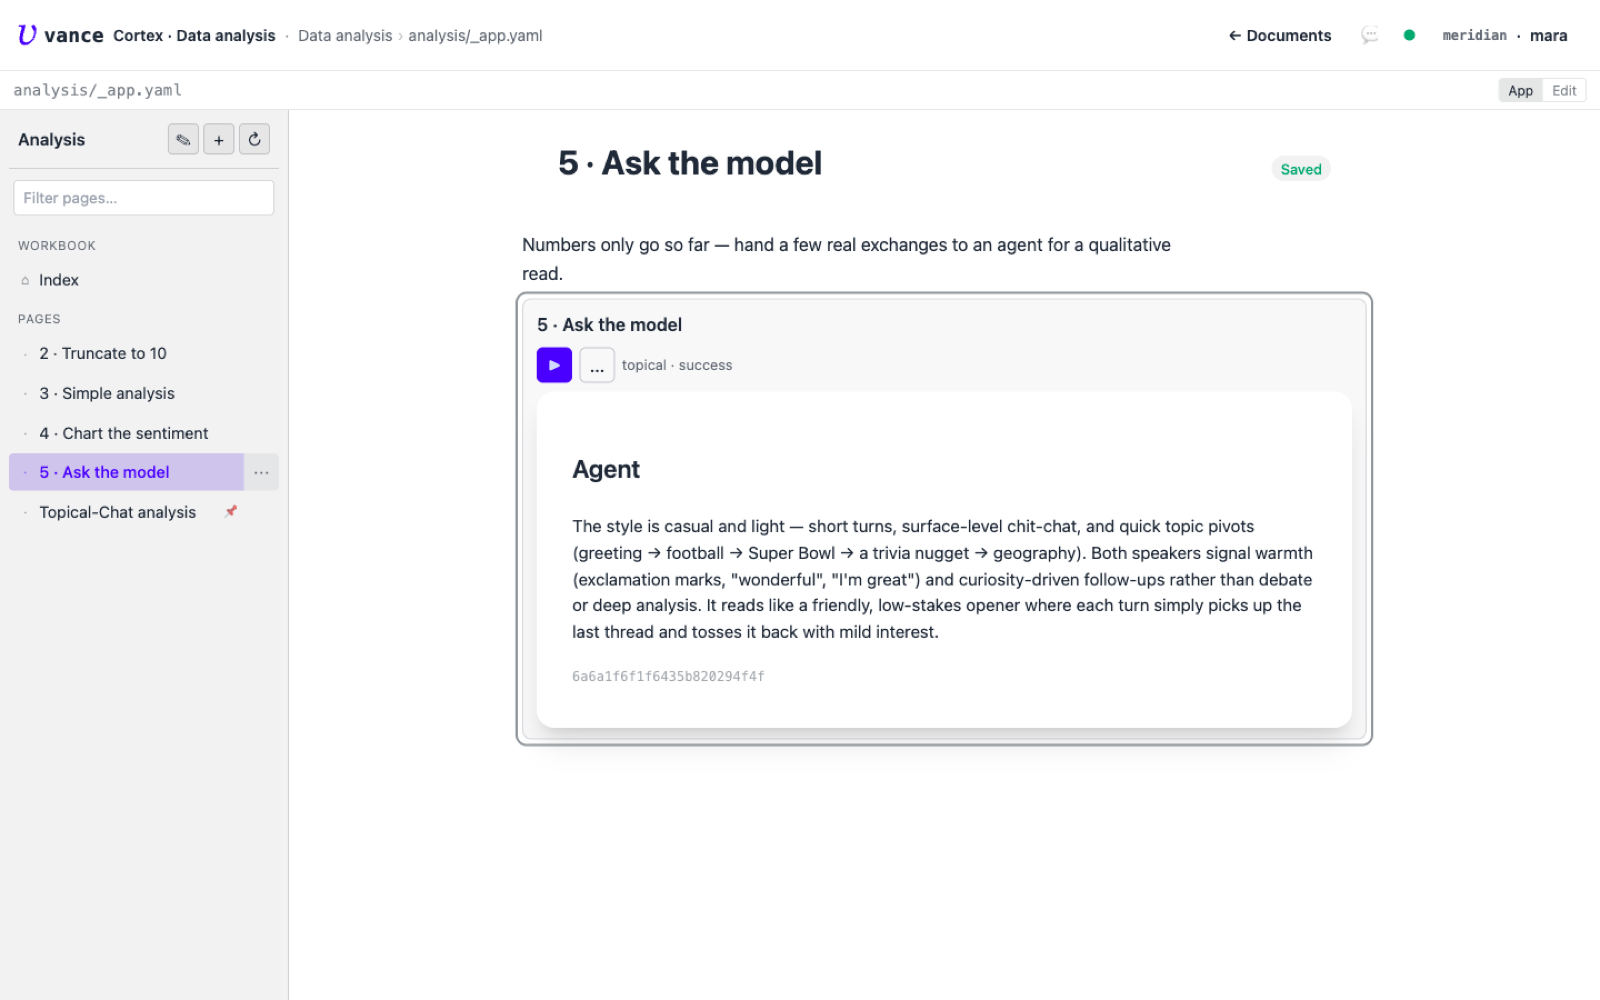
An
agentblock runs its session when you press ▶ in the page. The conversation, the file it read and the numbers it summarised all sit in the same project — so the answer is grounded in this analysis, not a generic one.
What this shows
- A goal reached in steps, not one shot. Pull → truncate → analyse → chart →
ask. Each block reads what the last one wrote, because they share the
topicalworkspace. Delete any one and the chain breaks — that’s what makes it a use-case and not five isolated demos. - The page is the notebook. Code, output, chart and an agent’s read live on one page, versioned like any document, runnable by anyone who opens it.
- Reproducible. Fixed seed, fixed cap, public data — press the five buttons again and you get the same result.
Where to go next
- The runtime behind these blocks — Shell, Python, LaTeX, agents — has its own reference: Damogran / Compose spec.
- How a chart document is structured: it’s just a
kind: chartfile — open one in Cortex and flip to Edit. - Haven’t got a running instance yet? Get started.