Size up a stock with live data
Ask a real question — “how’s this stock doing, and what do you make of it?” — and Vancetope does the whole thing: pulls the numbers off the web, draws them as a chart, and hands back an assessment that cites the data it’s standing on. One message in, a grounded answer out.
This uses live web research (a search provider the operator wired up) plus Vancetope’s native chart documents. The agent delegates the lookup to a research worker, builds the chart, and writes the verdict — you just ask.
Table of contents
Ask the question
One plain-language request: get Apple’s yearly prices for the last ten years,
chart them, and give an opinion. The agent recognises it needs live data,
spawns a research worker, and pulls the figures from the web (you can watch
web_fetch / web-research in the live-progress panel).
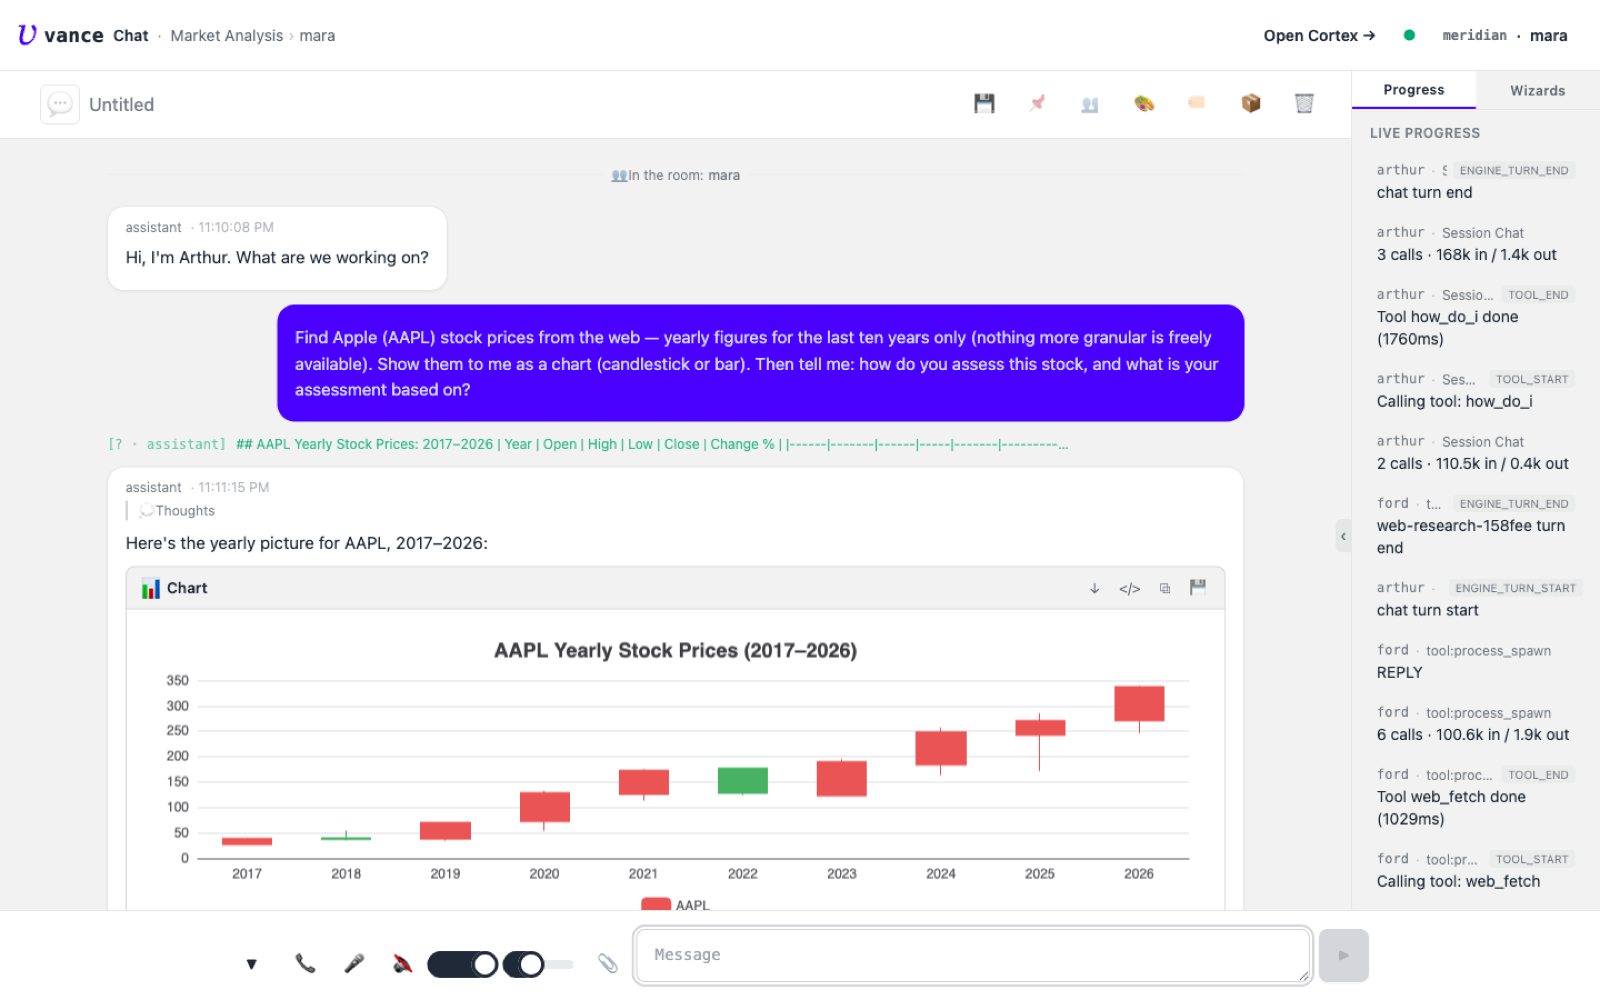
web_fetch on the right) and lays them out as a table before charting.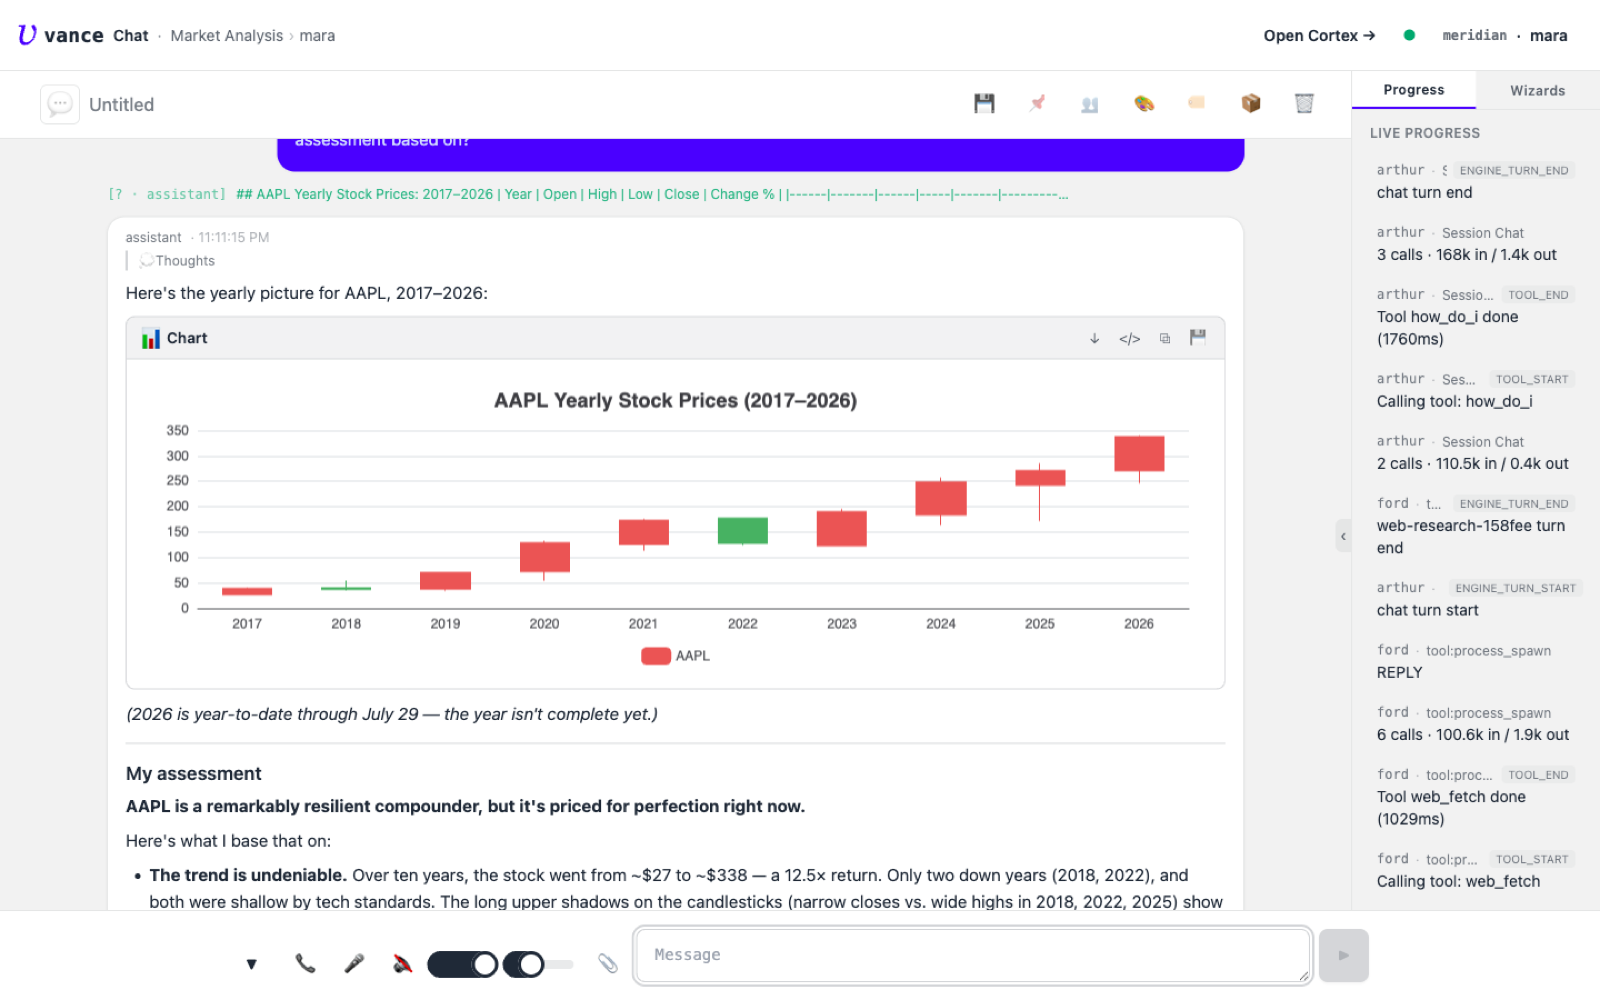
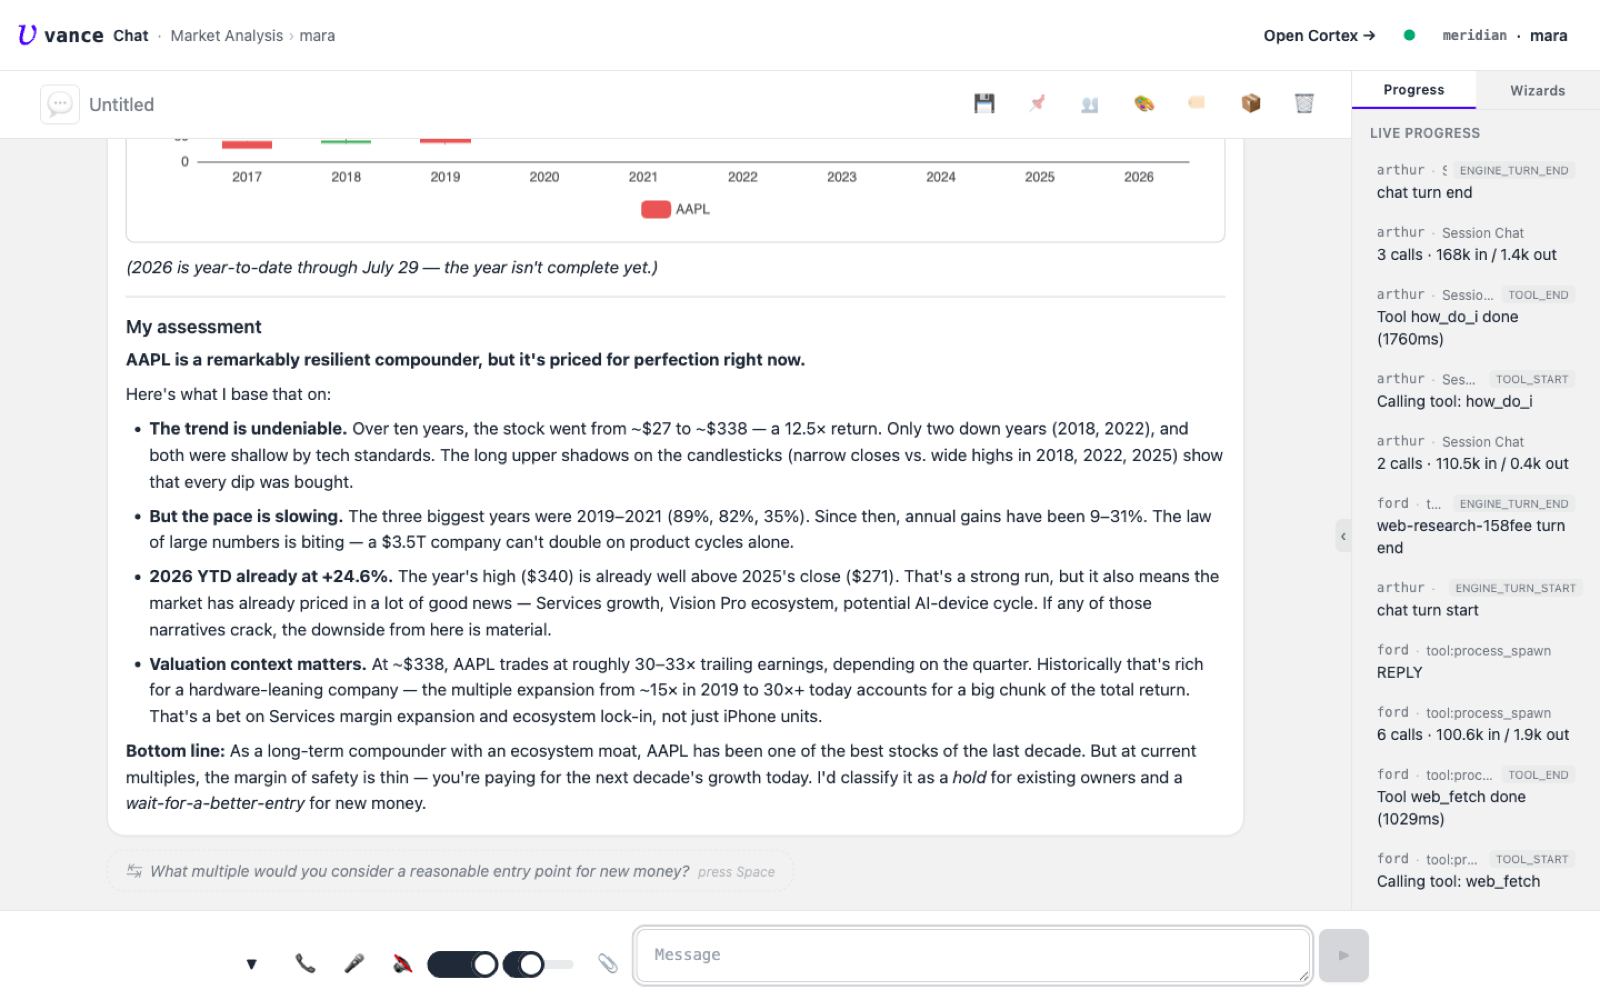
Why this is more than a chatbot answer
- It fetched real data, not a memory. The figures come from a live web lookup the agent ran itself — and it says so, including the caveat that the current year is incomplete.
- The chart is a real document. A native
kind: chart(candlestick), not a picture — you can open it, re-style it, or drop it into a workpage. - The verdict is grounded. Every claim in the assessment points back at a number from the chart. That’s the difference between an opinion and an opinion you can check.
Where to go next
- The research stack behind the web lookup: Zarniwoop spec.
- Build a chart yourself, step by step: Analyse a dataset.
- What a chart document is: chart kind.